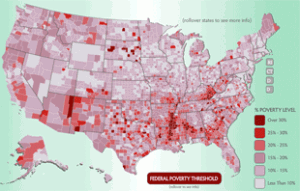
 In 2009, the number of Americans living in poverty reached its highest level in 51 years. Where are America’s poor? This interactive infographic based on US Census data, takes a regional look at poverty. Roll over each state to see its poverty rate, along with those for children ages five through 17 and for children under the age of five.
The graphic is posted on the VinFormation courtesy of Mint.com a personal finance well worth exploring. They have just opened a Canadian version of the site.
Tags: poverty, Poverty Analysis, USA

Thanks, this was a very fine visual! Keep up the great work, John and all!